Making Diagrams Fun With Mermaid
If you’ve studied software engineering in a traditional way and had some experience in the industry, you might be wondering how I can use “fun” and “diagrams” in the same sentence. Give me a few minutes of your time and you’ll learn how.
Do We Really Need Diagrams?
It is easy to overlook diagrams when you’re working at a non-corporation. Diagrams are often used in corporate companies with many teams, departments, engineers, outsourced resources, and complicated legal obligations.
In such cases, they’re often used as bureaucratic tools rather than as a way to transfer knowledge. This made hundreds of engineers I’ve worked with hate diagrams as a way to document things.
Yet, we still draw diagrams on whiteboards when we’re onboarding new teammates, discussing new architecture ideas, or presenting the roadmaps of our projects.
That’s because, sometimes, it’s nearly impossible to explain things with words.
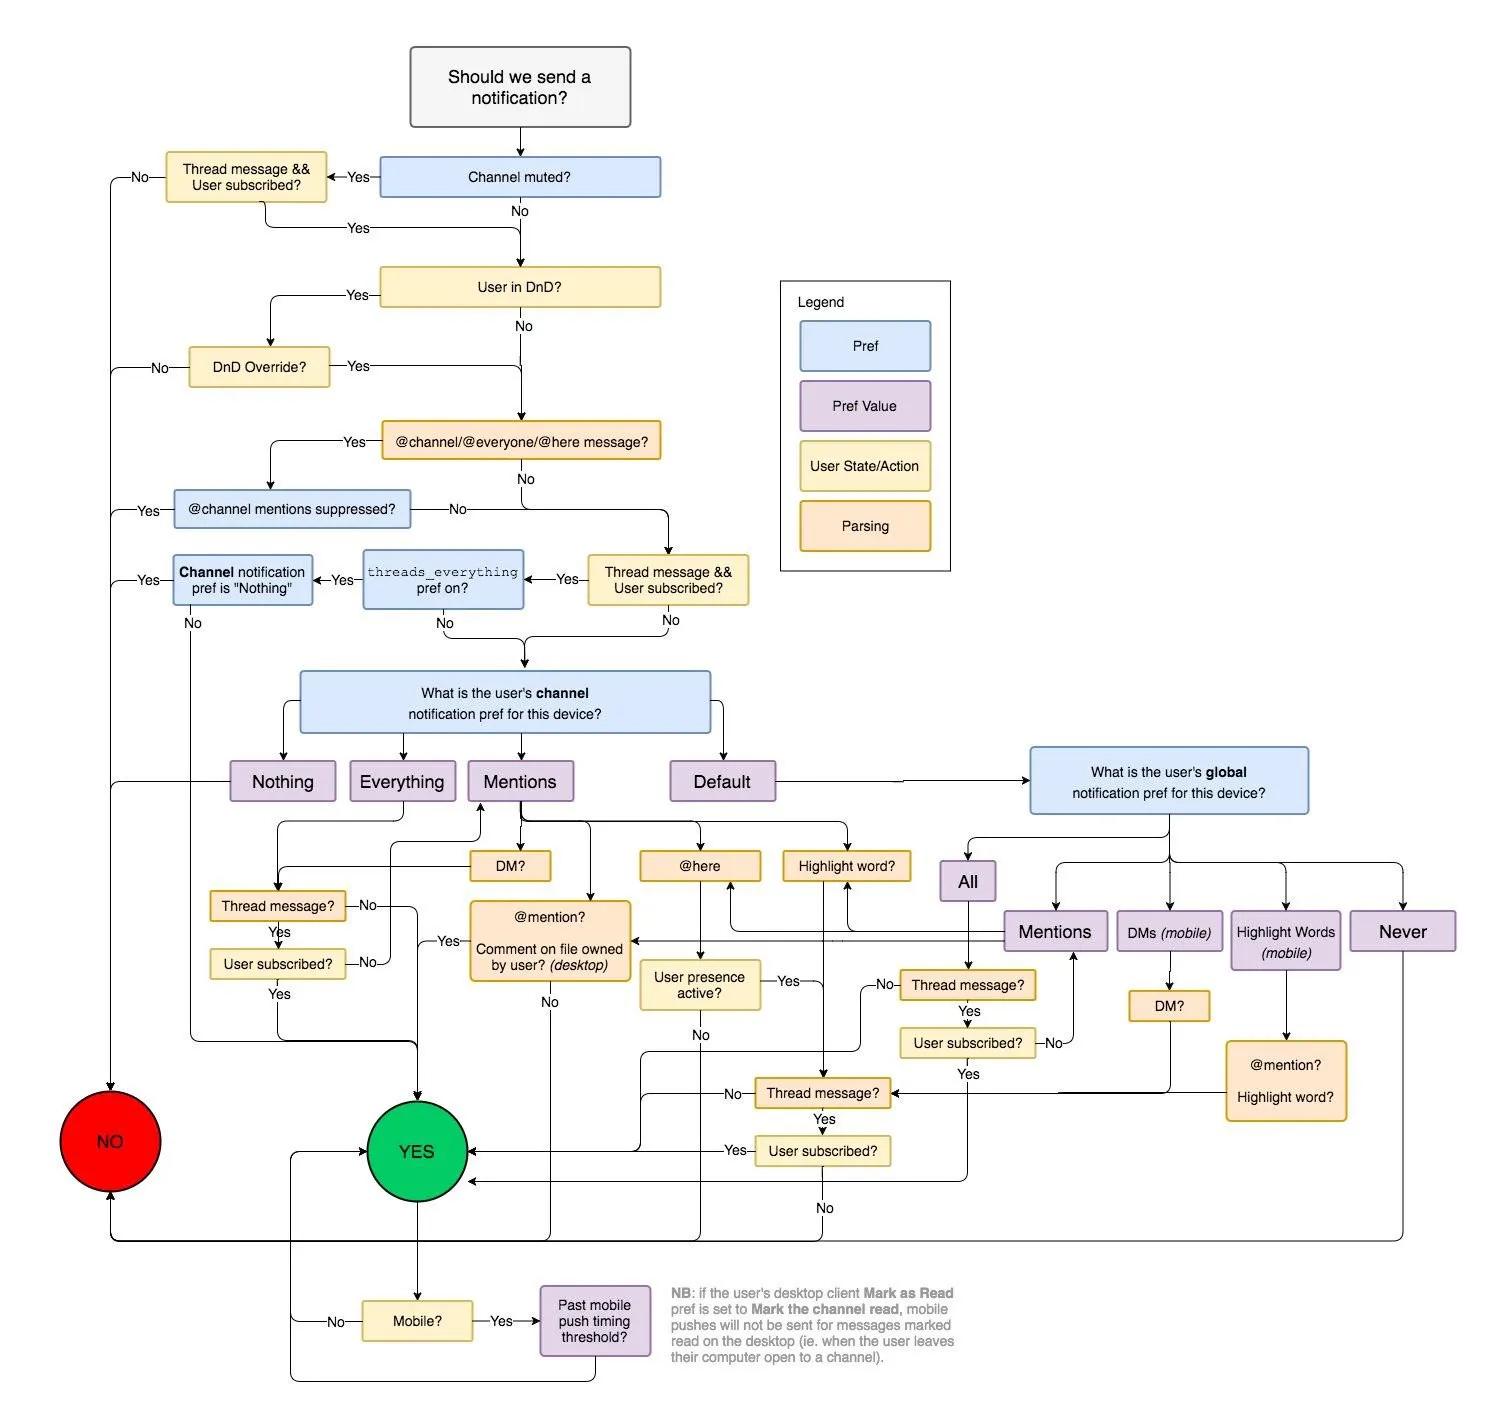
Below is a flowchart from Slack that presents the app and decides whether to send a notification or not.

Can you imagine documenting this by using only text? Or even worse, can you explain this verbally to someone and hope that they will actually remember it?
Why Don’t We Use More Diagrams Already?
Something I’ve seen often among software engineers is that drawing sequence or state diagrams or even some basic flowcharts are very much dreaded by many people.
Developers often appreciate a well-drawn graph for explaining software or infrastructure architecture but they’re very reluctant to draw one themselves. The most common reason for this is the tooling required to draw a diagram.
There are dozens if not hundreds of diagram-drawing tools out there with essentially similar but practically different interfaces. It takes an effort to learn this new UI, draw what you want to draw, export to a common format, insert the exported file into your documentation.
A few months later, however, those beautiful diagrams you drew will get outdated and you’ll need to do it all over again. But this time, you’ll need to find the source file of those diagrams, or if it’s an online tool, you’ll need to fetch the account credentials.
This process by itself is a minor irritation at best. However, if the person who drew the original diagrams has left the company or is somehow unavailable, it might get real troublesome to update these diagrams.
What usually happens in such cases is that those diagrams never get updated and are thrown away. I’ve seen too many pretty diagrams go to waste like that.
So, the cost of maintenance is the first reason developers prefer to stay away from drawing diagrams.
The second reason is the user interface provided by these diagram tools. Fancy, visually appealing drag-and-drop tools are surely impressive but one usually needs to rearrange elements pretty often.
This is quite a pain when you need to move elements all the time to make space for the new ones you’re adding. Even being able to automate this rearrangement process would be an amazing time saver.
How Is Mermaid Any Better?
What makes Mermaid interesting is the fact that it lets you define diagrams in a text-based, markdown-friendly way. This, in turn, makes it super easy to maintain and version-control these diagrams.
It also saves you from organizing the items in the graph by yourself by letting Mermaid figure it out for you based on your definition of the graph. Below is a basic example of what this definition looks like and what it translates to.
    graph TD
      A[Client] --> B[Load Balancer]
      B --> C[Server01]
      B --> D[Server02]
Which transforms into:
This is a simplified flowchart diagram of a load balancer. graph indicates to Mermaid that we want to draw a flowchart. We could also get a sequenceDiagram, classDiagram, gantt, pie, or a gitGraph.
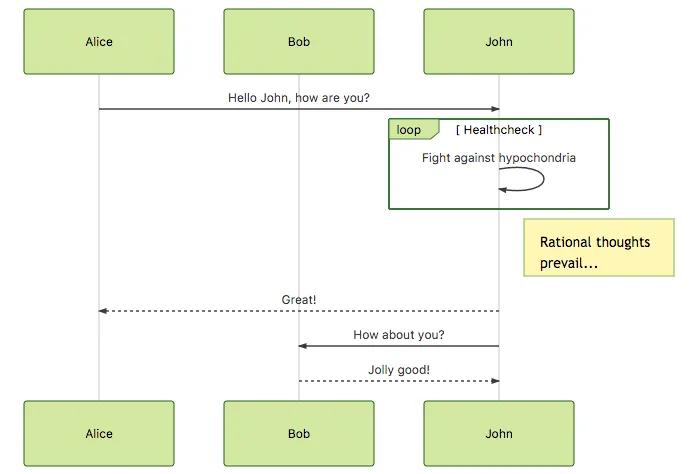
For instance, a sequence diagram would be defined as below:
gist:BetterProgramming/0686195ace9b1324f49c77e27b395fed#sequenceDiagram.js
This definition would generate:

Well, that was super easy! Go on and check out more complex examples provided by Mermaid. For detailed syntax and options of specific diagrams, check out the links at the end of this post.
Maintainability
I’ve mentioned before that Mermaid’s approach benefits us in terms of maintainability. What better way is there to talk about maintainability than by talking about version-control?
As it is with the code we write, the changes in our diagrams will first be visible on the diff view of Git.
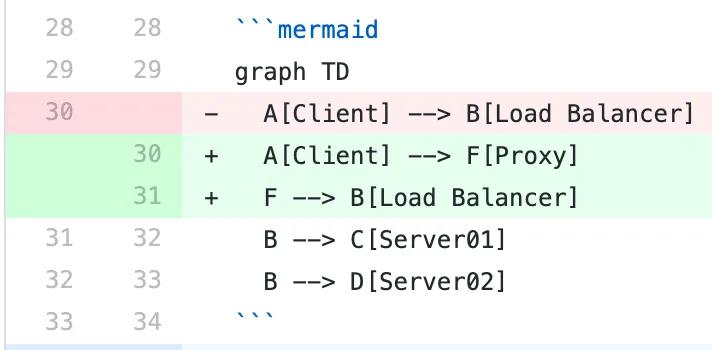
Since Mermaid is text-based, the diff in Git is much more clear in terms of what is changing and much easier to keep track of. Below is an example git diff of a usual diagram change:

Exploring the Live Editor
If you’re feeling too lazy to set Mermaid up and experiment, you can start with its live editor. It is very simple and intuitive to explore what your diagrams would look like.
The tool also lets you download your final creation as an image file so if you only need to sketch something quickly and post it somewhere, you’ll love it. My Slack conversations have become much simpler since I started using it.
Development Environment
As mentioned above, Mermaid’s live editor is a good place to start. However, we, of course, need easier and more integrated tools while editing the diagrams inside markdown files.
If you’re using Visual Studio Code, Markdown Preview Mermaid Support is a decent plugin to visualize your Mermaid graphs and markdown files within VS Code.
On GitLab
If you’re using GitLab, you’re in luck. GitLab already supports Mermaid in their markdown renderer. Which means you can safely use it. Here is the link to their documentation about Mermaid.
On GitHub
Unfortunately, GitHub does not support Mermaid.js natively. The feature request has been pending for about four years now. This leaves you two options:
- Use a browser extension to magically process Mermaid.js markup inside any markdown document. I recommend this Mermaid extension.
- Convert your diagram markup into PNG files using this CLI tool and refer to these images in your markdown documents.
Even though it is possible to automate the second approach using a continuous integration (CI) tool, I would go with option #1.
On Atlassian Confluence
There is a plugin you can add to your Confluence setup that allows you to import Mermaid graphs into your Confluence pages. Check it out here.
On custom documentation sites
If you’re planning on creating your own documentation site that you can host by yourself and want to include support for Mermaid on it, one good way of doing that would be to use a static documentation site generator such as Docsify or readthedocs.io.
This would not only provide built-in Mermaid support for you, but it would also save you from a lot of effort that comes with setting up your website.
However, if you already have a website and are looking to just seamlessly support Mermaid in your website, all you have to do is add Mermaid’s JavaScript package, which will compile your Mermaid definitions and render the corresponding diagram. You can install this either by running this:
yarn add mermaid
Or, if you have a website without a bundler, you can also insert the package the old school way via <script>:
<script src="<https://unpkg.com/mermaid/>"></script>
<script>
  mermaid.initialize({ startOnLoad: true });
</script>
You would then define your diagrams like below:
gist:BetterProgramming/94744b5d6b38a1f09eadc3dd394a50d8/mermaid.js
For more details and configuration options, check out the documentation here.
Customizing the Style of Your Diagrams
You might have noticed that Mermaid’s default styling is OK but it is not the prettiest. No one will judge you if you want to change it.
I’ve, for example, made a custom style to make it fit my employer’s brand colors so that it seems much more professional when using it at work. This would also save you from some extra effort if you want to use the diagrams during work-related presentations.
Mermaid uses CSS to style the diagrams. This lets us extend the CSS definition and assign values based on our preferences.
If you’re importing Mermaid into your website, just adding CSS with correct selectors will be enough. Check out the links at the end to see the documented CSS selectors for each diagram type.
It is also possible to add your styles if you’re generating images from Mermaid graph definitions. The Mermaid CLI is a good tool for generating such images from a command-line interface. You can attach your CSS to it using the -C or --cssFile options.
Customizing the style while using Mermaid over a third-party solution like GitHub or GitLab is unfortunately not very simple. There isn’t any official way of doing it unless the service you’re using specifically supports it.
Final Words
If I managed to pique your interest, I suggest you take a look and give Mermaid a try. It might save you a lot of time and make you like diagrams again.
Thanks for reading my article. Let me know what you think about it in the comments.
